Test if two variables jointly control changes in fossil data
Source:R/jointsig.r, R/plot.js.R
jointsig.RdGenerates synthetic variables with different proportion of two environmental variables, and tests how much variance in the fossil data reconstructions of these synthetic variables explain.
Usage
jointsig(spp, fos, var1, var2, method = "randomTF", n = 99, r = 32, ...)

# S3 method for class 'js'
plot(x, names.v1, names.v2, ...)
Arguments
- spp
Data frame of modern training set species data, transformed as required, for example with sqrt
- fos
Data frame of fossil species data, with same species codes and transformations as spp
- var1
Training set environmental variable 1
- var2
Training set environmental variable 2
- method
Which significance test to use. Current option are randomTF and obs.cor. The latter may give strange results - use with caution.
- n
number of random training sets used to generate the null model
- r
How many synthetic variables to make. More is better but slower
- ...
Other arguments to plot
- x
Output from jointsig
- names.v1
Vector length 2 with names of the end members of the first environmental variable, e.g., c("cold", "warm") for temperature.
- names.v2
Ditto for the second variable.
Value
A list with components
- PCA
The unconstrained ordination of the fossil data.
- preds
A list of the containing the reconstructions for each environmental variable.
- MAX
Proportion of the variance explained by the first axis of the unconstrained ordination. This is the maximum amount that a reconstruction of a single variable can explain.
- EX
The proportion of the variance in the fossil data explained by each reconstruction.
- sim.ex
The proportion of variance explained by each of the random environmental variables.
- sig
The p-value of each reconstruction.
Details
With method="randomTF", the function calculates the proportion of
variance in the fossil data explained by transfer function reconstructions of
synthetic variables.
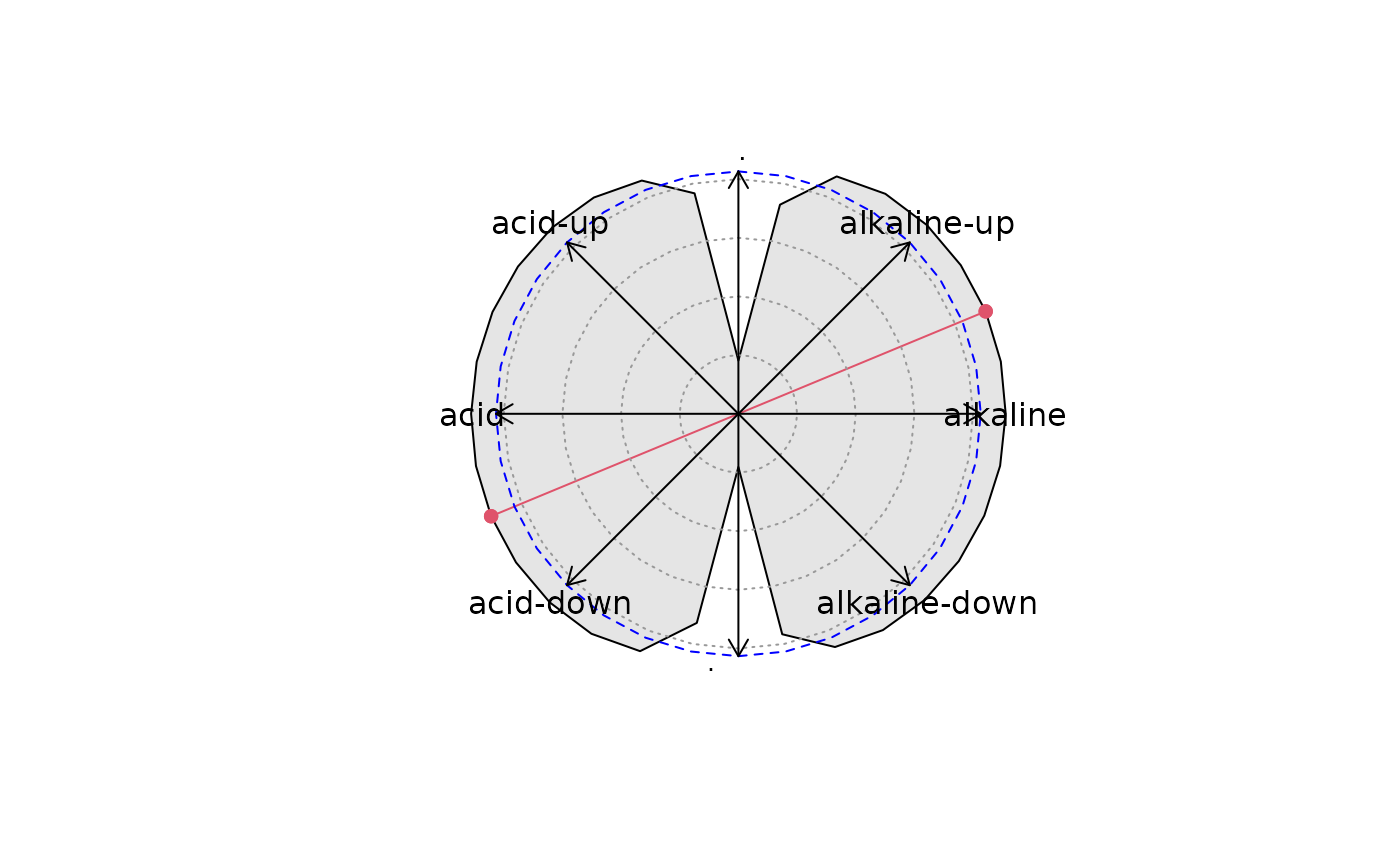
The synthetic variables are composed of two environmental variables, weighted
between -1 and +1, so to represent a circle.
This is compared with a null distribution of the proportion of variance
explained by reconstructions based on random environmental variables.
Any transfer function in the rioja library can be used.
With method="obs.cor", the aim is the same, but the function reports the
correlation between the species weighted average optima on the synthetic
variables and the species first axis scores.
This option has some pathological behaviour and should probably be avoided.
References
Unpublished method - use with caution. Can give spurious results with weighted averaging.
Author
Richard Telford richard.telford@bio.uib.no