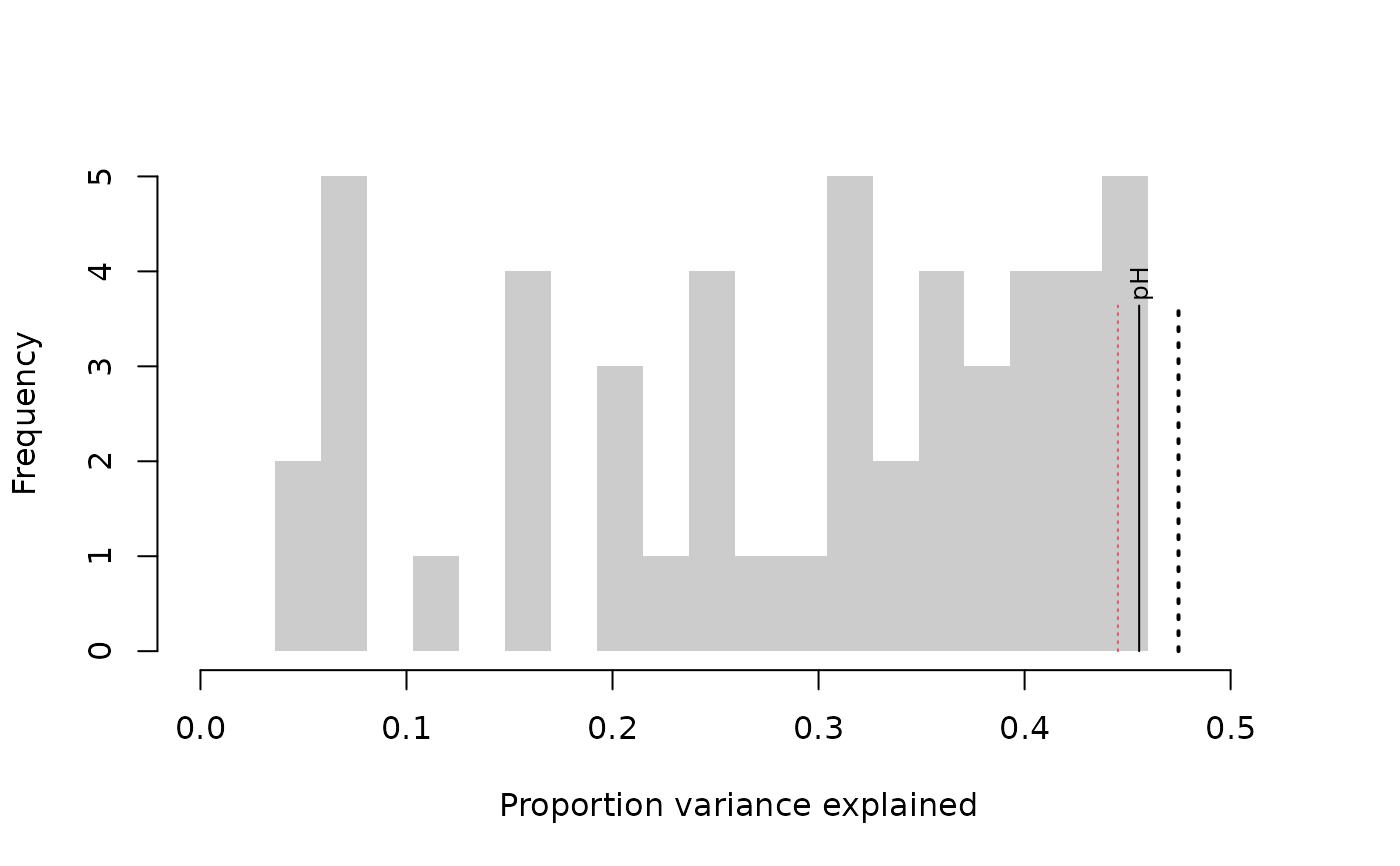
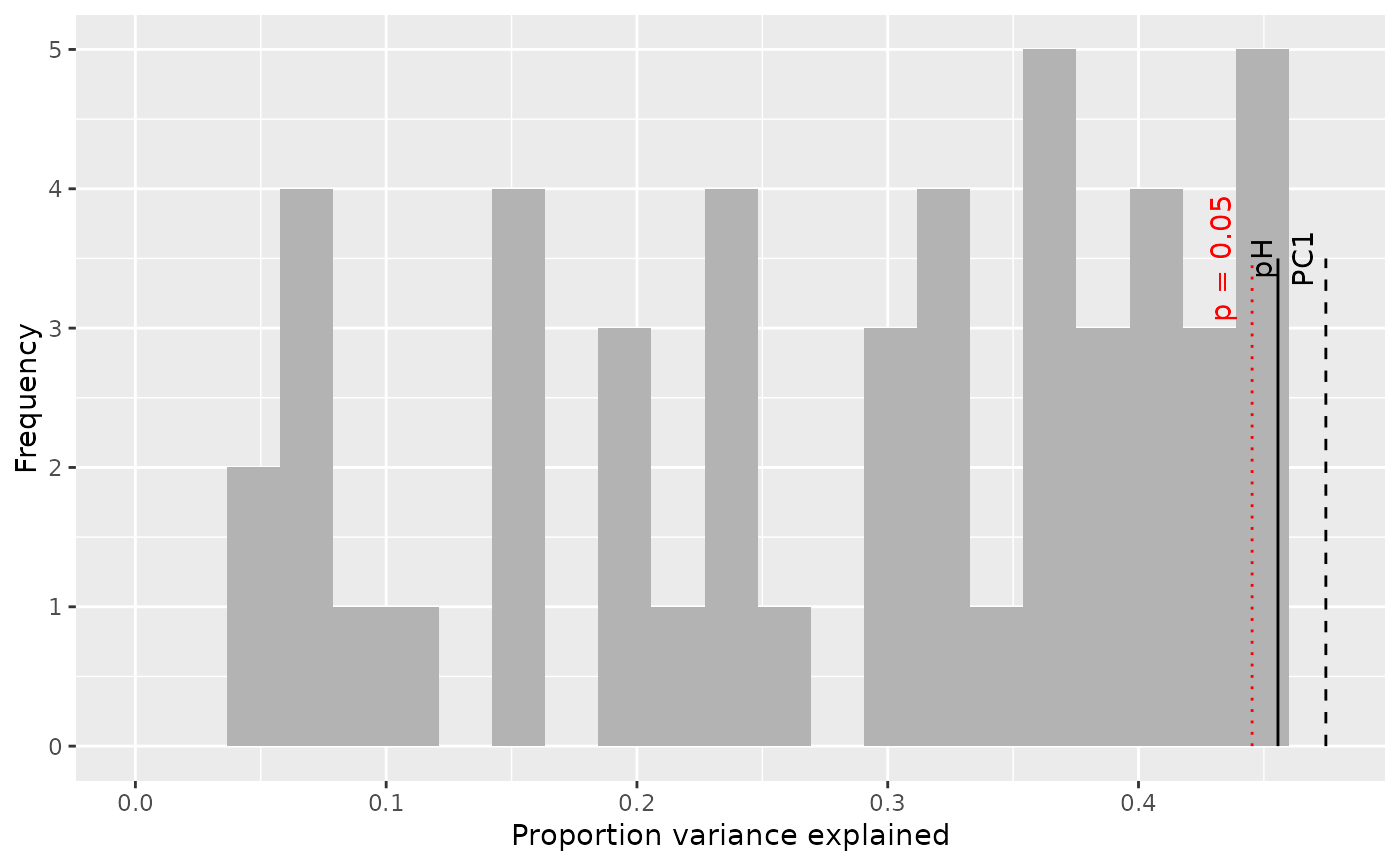
Proportion of variance in the fossil data explained by an environmental reconstruction
Source:R/1_randomTF.R, R/plot.palaeoSig.R
randomTF.RdCalculate the proportion of variance in the fossil data explained by an environmental reconstruction with a constrained ordination. This value is compared with a null distribution calculated as the proportion of variance in the fossil data explained by reconstructions from transfer functions trained on random data.
Usage
randomTF(
  spp,
  env,
  fos,
  n = 99,
  fun,
  col,
  condition = NULL,
  autosim,
  ord = rda,
  permute = FALSE,
  models,
  make_models = FALSE,
  ...
)

# S3 method for class 'palaeoSig'
plot(x, variable_names, top = 0.7, adj = c(0, 0.5), p_val = 0.05, ...)

# S3 method for class 'palaeoSig'
autoplot(object, variable_names, nbins = 20, top = 0.7, p_val = 0.05, ...)
Arguments
- spp
Data frame of modern training set species data, transformed as required for example with
sqrt- env
Data frame of training set environmental variables or vector with single environmental variable
- fos
Data frame of fossil species data, with same species codes and transformations as
spp- n
number of random training sets. More is better.
- fun
Transfer function method. Additional arguments to
funcan be passed with...- col
Some transfer functions return more than one column of results, for example with different
WAPLScomponents.colselects which column of the reconstructions to use. See the relevant transfer function method help file.- condition
Optional data frame of reconstructions to partial out when testing if multiple independent reconstructions are possible.
- autosim
Optional data frame of random values. This is useful if the training set is spatially autocorrelated and the supplied data frame contains autocorrelated random variables. If
autosimis missing, andpermuteisFALSE, the transfer functions are trained on random variables drawn from a uniform distribution.- ord
Constrained ordination method to use.
rdais the default,ccashould also work.capscalewon't work without modifications to the code (or a wrapper).- permute
logical value. Generate random environmental variables by permuting existing variable. Only possible if there is only one environmental variable and
autosimis missing.- models
list of models made by
randomTFwith argumentmake_models = TRUE- make_models
logical, should a list of transfer functions trained on random data be returned
- ...
Other arguments to the transfer function. For example to change the distance metric in
MAT. Also extra arguments to plot.- x
Output from randomTF
- variable_names
Names of environmental variables. If missing, taken from
envdata.frame.- top
Proportion of the figure below the environmental name labels.
- adj
Adjust the position that the environmental names are plotted at.
- p_val
P value to draw a line vertical line at (with which=2)
- object
Output from randomTF
- nbins
integer giving number of bins for the histogram
Value
A list with components
- PCA
The unconstrained ordination of the fossil data.
- preds
A list of the containing the reconstructions for each environmental variable.
- MAX
Proportion of the variance explained by the first axis of the unconstrained ordination. This is the maximum amount that a reconstruction of a single variable can explain.
- EX
The proportion of the variance in the fossil data explained by each reconstruction.
- sim.ex
The proportion of variance explained by each of the random environmental variables.
- sig
The p-value of each reconstruction.
If make_models = TRUE, a list of transfer function models is returned.
autoplot.palaeoSig returns a ggplot2 object
Details
The function calculates the proportion of variance in the fossil data explained by the transfer function reconstruction. This is compared with a null distribution of the proportion of variance explained by reconstructions based on random environmental variables. Reconstructions can be partialled out to test if multiple reconstructions are statistically significant. If the environment is spatially autocorrelated, a red-noise null should be used instead of the default white noise null. Red noise environmental variables can be generated with the gstat package.
Any transfer function in the rioja package can be used. Other methods (e.g. random forests) can be used by making a wrapper function.
If reconstructions from several sites are to be tested using the same
training set it can be much faster to train the models on random
environmental data once and then use them repeatedly.
This can be done with make_models = TRUE and then running
randomTF again giving the resultant models to the models
argument.
make_models does not work with MAT.
For some transfer function methods, including WA, the code can be made
somewhat faster by coercing the modern and fossil species data to matrices
(spp <- as.matrix(spp)), otherwise WA has to do this repeatedly.
With MAT, this should not be done as it might cause an error.
Functions
plot(palaeoSig): Plot palaeoSig objectautoplot(palaeoSig): autoplot function for palaeoSig object
Note
If there are only a few fossil levels, obs.cor might have
more power.
If there are few taxa, tests on MAT reconstructions have
more statistical power than those based on WA.
References
Telford, R. J. and Birks, H. J. B. (2011) A novel method for assessing the statistical significance of quantitative reconstructions inferred from biotic assemblages. Quaternary Science Reviews 30: 1272–1278. doi:10.1016/j.quascirev.2011.03.002
Author
Richard Telford richard.telford@uib.no