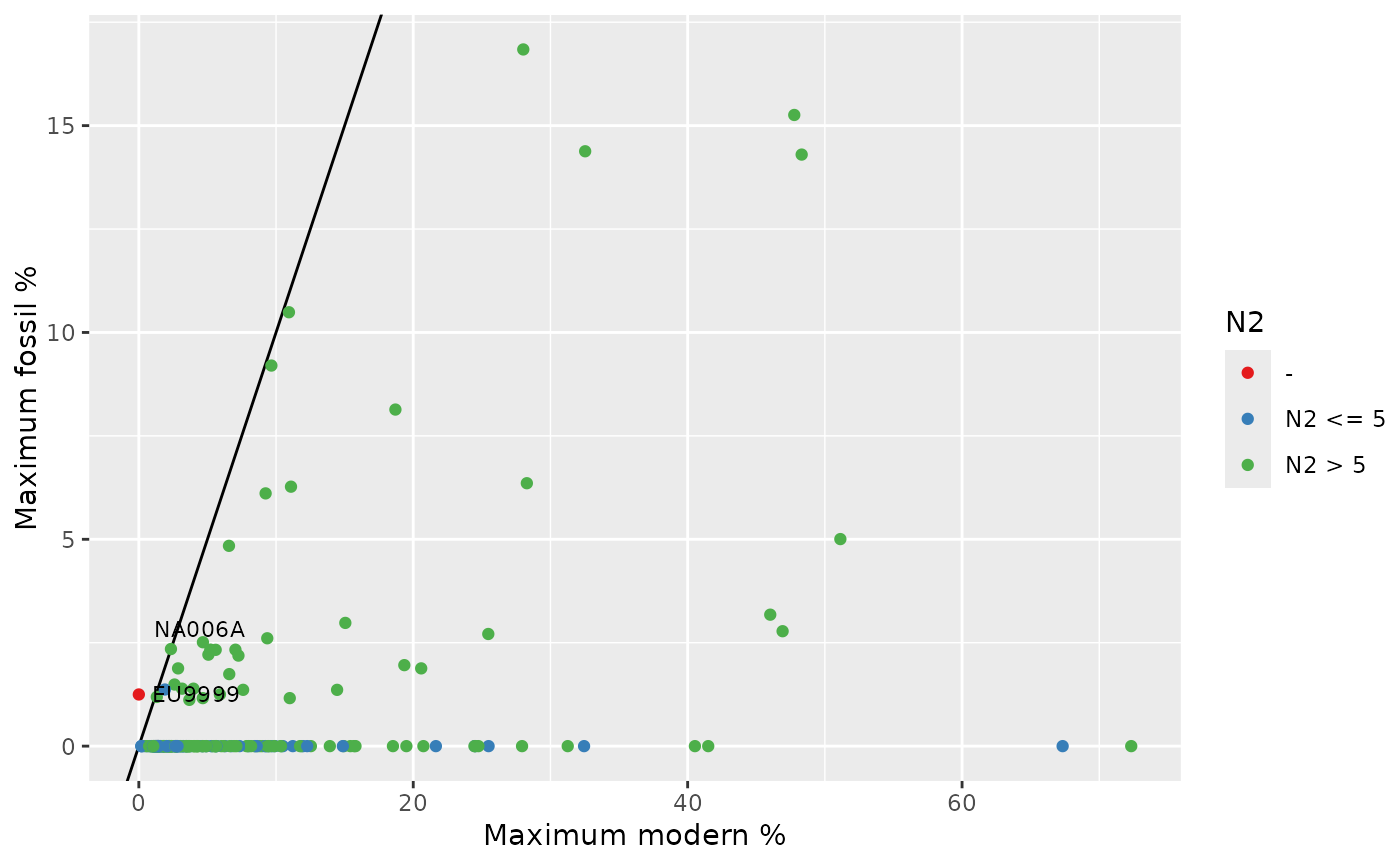
A simple diagnostic plot showing the coverage of fossil taxa in modern calibration set
Arguments
- spp
data.frame of modern species abundances
- fos
data.frame of fossil species abundances
- n2_rare
numeric value of Hill's N2 below which species are highlighted as rare
- label
numeric label taxa where maximum fossil abundance - maximum modern abundance > label. Defaults to NULL which does not add labels
Value
A ggplot object.
Details
Finds the maximum abundance of fossil taxa and plots this against
the maximum abundance the taxa in the modern calibration set.
Taxa with a Hill's N2 less than rare in the calibration set are
highlighted in blue.
Taxa absent from the calibration set are highlighted in red.
If there are many taxa above the 1:1 line, or important fossil taxa have a
low N2 in the calibration set,
reconstructions should be interpreted with caution.